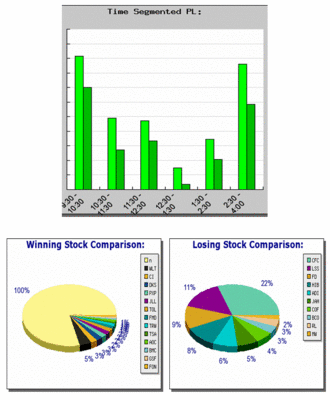
End of Month Trading Journal / Heat Map

This is just a review of my P&L Heat Map for the month of August 2005.My first original post about journals/heat maps was done on August 18th for stocks as percentage of winners and losers, and on August 6th for P&L by time segment here and here. Please refer to the links for a better understanding of the above charts.
End of Month Review: August 2005
Average hold time: 00:03:44
Total positions held: 406
Total symbols traded: 39
Winning trade %: 66.57%
Losing trade %: 33.43%
In the winning stock comparison chart n=NEW,trades from that one stock made up the bulk of my profits for the month.Also in the Time Segmented P&L as the month progressed my best times for trading were in the morning 1st two hours approximately and the last hour and half.


0 Comments:
Post a Comment
<< Home