This blog has moved to

  • SlyTrader.net
  • Wednesday, August 31, 2005

    Taking a Small Vacation!!

    I will be taking a small vacation the rest of the week until Wednesday of next week.Although I do not like to detatch myself from the markets,especially when trading is good, I will be going to do a little COHO Fishing for the weekend,although I might have to settle for trout,we'll see.Will try and post a few thoughts and personal ramblings throughout the week,but for now,I'm out of here.Good trading all,and God bless all the people that have been affected by Katrina.

    Donate to the Red Cross here

    Winning Trading Strategy / Another Example


    This seems to be a recurring trade as of late.I only caught a very small piece of it,and the fact is I need to really start paying attention to these trades.I've shown a few examples of this trade in the past week or so and they keep appearing.The basis of this trade is a small channel forms between the 5 period sma and the 15 period ema.When price trades into the 5 sma as this channel widens there seems to be an explosion to the upside for longs and the downside for shorts.One characteristic coming to my attention is that the stock will be on track to trade at least 1.5 times it's average volume or higher.I have seen this pattern recurring in non-news related items also.I let myself get caught up in my comfortable stocks a little too much and missed the bulk of this move. For more examples of this type of trade go here and here.

    Trades Today / 08/31/05

    Trades

    NEW short at 43.10 covered at 42.94 +.16

    NEW long at 43.09 sold at 43.20 +.11

    GSF long at 47.01 sold at 47.20 +.19
    (This thing had a nice run,missed it early.Originally showed up on the Trade-Ideas scan,I just wasn't paying attention.It was a great setup off the 5sma. I will post chart later.)

    ALL short at 54.89 covered 54.80 +.09

    NEW short at 42.19 covered 42.07 +.12

    NEW short at 41.89 covered 41.79 +.10

    NEW long at 42.40 sold at 42.72 +.32
    (had MACD rising across three time frames,and rising 5 period sma)

    Tuesday, August 30, 2005

    Trades Today 08/30/05 : Recap

    Well if you can't beat'em join 'em.Had to turn long for the afternoon trades. Today was a tough one seems to be no real direction or follow through either way at the moment.I'm calling it a day here,didn't see much opportunity today,but all in all it was a decent day. Good trading to everyone!

    NEW long at 41.29 sold at 41.40 +.11(early exit,running up slightly)

    NEW long at 41.02 sold at 41.19 +.17

    NEW short at 41.00 covered at 40.64 +.36

    NEW long at 41.02 sold at 41.25 +.23

    Weekly Head and Shoulders / NEW


    What in the world is holding this thing up? Great head and shoulders pattern on the weekly chart, they just won't let it drop though,yet... If it does break say 40.50 I would expect a move down around 34.00,longer term.Unless of course the homebuilders decide to rally again.Might rally back up to the right shoulder one more time if that happens,but I doubt it.

    Briefing.com

    FOMC minutes coming up at 2:00pm....
    Here's a little snippet of how the markets look right now.

    13:21 Broad based weakness, amid heavier volume

    The averages have pushed off of their midday lows but the overall bias remains firmly bearish. The slide in the wake of yesterday's recovery is disappointing, has come amid heavier volume (Nasdaq 813 mln, NYSE 763 mln) and has been broad based in nature.

    Trades Today 8/30/05

    NEW short at 41.00 covered at 40.64 +.36

    NEW long at 41.02 sold at 41.25 +.23

    Economic Data Today 8/30/05

    Consumer confidence and Factory orders will be coming out at 10:00am,along with the FOMC minutes coming at 2:00pm today.

    Consumer confidence consensus is 101.00, the prior was 103.2....

    Monday, August 29, 2005

    Bulls in Control?

    Well I have to hand it to 'em looks like the bulls took over today or was that a short squeeze? Either way it looked like a fairly good reversal day for them.

    DKS Possible Trade/ Cancelled

    Volume too low to take that one,I passed on that one.

    DKS Possible Trade

    DKS is making lows and there might be a possible trade nearby.Will update later.Volume is still very light though and might not be enough for any follow through.

    Monday Trading / Light Volume

    There's not much in the way of volume today so far.TraderEyal makes a good point about the action thus far and I have to agree.Only had a couple decent opportunities early on.We'll see if things pick up later on maybe the big boys will step up to the plate or will they be a no show? Comments on the SPR (oil reserve) will also be coming out,we could see some volatility off that....

    Morning Trades

    NEW short at 41.50 covered at 41.27 +.23

    NEW short at 41.60 covered at 41.52 +.08

    PXP short at 35.00 covered at 34.82,34.80 +.18,+.20

    News Trumps All!

    Oil made highs and is now trading off a bit.News will always trump any technical patterns. Right now the focus is on oil.Could be a bit whipsawish today.So far minor support in the SPU5 held at about 1202.00...Watch this level here.

    Not getting the follow thru on the short side yet...

    Trades

    NEW short at 41.50 covered at 41.27 +.23

    Ugly Trading Day For the Longs Monday?

    I have a feeling Monday could be a really ugly day for the longs.I've been sifting through some stock charts and there has been some really nasty breaks in some of them.I won't try to anticipate anything,but will see what the market offers up.There may be some really good shorting opportunities as I feel we have not yet seen the flush and rinse of the longs quite yet.I only trade what's in front of me so I will be prepared to trade either long or short,but I have to favor the short side until I really see the longs get flushed here and capitulate.Watch the volume for clues.

    Friday, August 26, 2005

    Winning Trading Strategy


    I have briefly gone over this strategy yesterday on the TOL trade.Repetition is good for the mind.Unfortunately I missed a big part of the move for reasons of personal matters.Ok,the strategy consists of a 5 period simple moving average(5sma) and a 15 period exponential moving average(15 ema).The examples are of a short sell on NEW.If you click on the chart it should open a new window for easier reference back to the chart.Top of chart,there was the 1st entry signal when the 5 sma crossed down thru the 15 ema,I was able to scalp some of that move.Now as that crossover took place there is some space between the two averages which I refer to as a channel.Notice that price never penetrates back through the 5 sma and never even comes close to the 15 ema.Now there will be cases where price will trade back up to the 15 ema and generally that should be used as a stop out point.Use your own discretion on the stops,that will depend on your own risk tolerance,but as a rule of thumb you should use either a few pennies away from the 5 sma or the 15 ema as your stop price.

    There are a couple of triggers for entry on this trade.
    #1: The first crossover of the moving averages after sideways action(top of chart).
    #2: As price moves away from 5 sma it will eventually trade right into it.(Refer to the missed entry on the chart at 42.50.There was a small inside bar right before that.Another entry of this nature was the second bar up from that.)

    Now for the exit triggers.
    #1 Referring to the chart there was a large peak in volume on the third red bar from the missed entry.That would warrant taking half off for me.
    #2 There was a stochastics crossover to the upside on that candle followed by a stochastics move back up thru the 20 band.(On the chart this is where it says Stochastics exit signals with arrows.There are also two black horizontal lines,the top is the 80 band and the bottom is the 20 band.Rule of thumb is when the stochastics crosses up through the 20 band that is a buy signal,and when it crosses down through the 80 band that is a sell signal.(That's a whole different post in itself...)
    #3 If you waited you could have also exited on the first break back up through the 5 sma or the trade up to the 15 ema.
    #4 When the channel between the averages gets wider than your initial risk tolerance,it's time to take some or all of the position off. For example on the chart there was a huge volume peak,the distance between the next bar and the 15 ema was about .40 cents away. If your original stop was .10 or .15 then it's definately time to take some off.

    This example is based on the 5 minute chart.It can be used over several other time frames.(5 and 15 minute are the most common.)

    The entire move in this example was about 1.23.Not a bad trade if the rules are followed.This setup has been showing up a lot in several of my trades,therefore I will start trying to adhere to it more in the coming trading sessions.I will follow up with my results in the near future.....

    Trading Without a Safety Net

    Well, this is the third time this week my trading firms servers have gone down.You gotta love it! "Luckily I've been able to either get out of my trades or just haven't been in one when this has happened.It amazes me how irresponsible a big firm like this can be.Anytime there is volume they go down lately,causing either losses to some traders(not me luckily) or missed opportunities,as I like to trade when there is actually some volume.Man I would love to throw the name of them out there,but I won't!!! I might call it an early weekend,as I had a few good trades in the morning,and have lost my edge with the fact that their servers could go down again.

    Good Trading all!!

    Today's Trades

    The SPU5 has broken that minor support of 1210.50 slightly.

    NEW short at 42.98 covered 42.85 +.13
    NEW short at 42.77 covered 42.65,42.61 +.11,.16
    NEW short at 42.00 covered 41.88,41.77 +.12,+.23 (missed the setup from 42.50 short,because of distractions,ughhh!)Great setup too,I'll post later...

    Friday Trading

    We have Michigan Sentiment coming out at 9:45am with consensus of 92.5,and Greenspan will be talking at 10:00am.

    The indices should either stay rangebound or we could see some whipsaw action after 10:00am.

    SPU5:
    Minor intraday support at 1210.50...next support at 1202.02
    Minor resistance at 1213.50 and 1216 area.

    Trade Review / TOL Short Sell

    Sometimes trading systems need minor adjustments to enhance the profit potential. Most of my trading is done by reading the Nyse open book and combining some chart analysis along with it.Here's a trade where I really could have implemented a better trading strategy,especially with the kind of support I had in the book.By support I mean the number of shares and orders still showing at or above my point of entry short.

    This strategy works well with Nasdaq or Nyse stocks. I only trade Nyse,but the trader whom introduced me to this strategy uses it on Nasdaq and does very well.The strategy consists of a 5 period simple moving average and a 15 period exponential moving average(respectively called the 5 sma and 15 ema). Yesterday Tol was traded to the short side therefore I will only explain the short side of this strategy,everything can be reversed for longs. When the 5sma and 15ema are trading sideways and the 5 crosses down thru the 15 it begins to create a small opening which I will call a channel as you can see in the top of the chart.Now as price trades down,the channel will begin to expand/widen and price will eventually trade right into the 5sma,this is where you take your entry as close to the 5sma as possible using the 15ema as a protective stop.Depending on the width of the channel,you want to use your own discretion as to your risk tolerance.This method works best if you can use the 15ema as your stop,which in this example was never more than .10 to .15cents away from the 5sma.

    Notice in the chart where the channel begins to widen and the 5sma begins to trade down away from the 15ema.I then found a good entry short off the 5sma and plenty of support in the nyse book.My entry was at the top of the big red bar right after that thin shooting star and below its open at 48.75.I based my out/exit off the Nyse book and as the trade progressed(rather quickly) I decided to book the profit(again rather quickly) at 48.51 for a +.24 profit.Here's my point of this trade,notice that price never penetrated back up through the 5sma after my entry short,and well never even came close to the 15ema.Had I used this method this trade could have easily produced a .60 to .70cent winner.At the same time I had never lost my original exit, the orders remained in the book.I also had my MACD trending down across all three time frames of 5,15,and 60 minute charts.The 5 and 15 period moving averages can be used effectively across most time frames,but are most effective across the 5 minute and 15 minute charts.(You can also use a 6 minute and 13 minute chart).This method also involves some other details that can be added on for even more confirmation of the move. I will post more about that soon...

    Thursday, August 25, 2005

    Thursday Trading Wrap-Up

    Trading was very rangebound today, but it did offer up some great scalping opportunities.TOL came off it's high of 51.72 to close at it's low of 48.04...

    I'll have to review that trade a little later,entry was great but the exit not so great.The charts would have kept me in a little longer if I would have followed a method I was taught by another trader using a couple moving averages.I'll have a post on that coming up soon.

    Good Trading all!!

    "Scalps" Today

    Scalps For Today:

    Trades

    NEW Short at 43.55 covered at 43.44 and 43.40 +.11,+.15

    NEW Short at 43.40 covered at 43.21 +.19

    NEW Short at 43.17 covered at 43.25 -.08

    NEW Short at 43.27 covered at 43.17 and 43.08 +.10,+.19

    TOL Long at 49.40 sold at 49.58 +.18

    NEW Short at 42.98 covered at 42.85,42.81 +.13,+.17

    TOL Short at 48.75 covered at 48.51 +.24

    The payout cyle is back, hmmm... maybe I should have swing traded today's tight range.:-)

    Link about Scalping Vs. Swing Trading

    Here's an interesting link I found over at TraderMikes' on the subject of scalping vs. swing trading. I have to agree with the author on one point,here it is... Pinpoint precision comes from discipline, skill, confidence and decision making of the highest degree possible in shortest periods of time. Well said, but isn't that required in any trading style or is it ok to get slothy in different styles.Now the part about learning to scalp being compared to handing over the keys of a daytona race car,hmmmm... No, I have to disagree with that, unless your starting out with the most volatile stocks.When learning to scalp it is better to start out small,and pick stocks that are not quite as volatile.Average volume of the stock can make a big difference there.When you have become more proficient at scalping then you can move into some of the more volatile stocks. I will agree it's not the easiest style to learn and it has it's place during different market conditions just as any style does.If the market is in a 5 to 10 point range for the day,swing trading will not be your best bet.That is a pure scalpers market. Every style requires that you assert the market conditions at hand, I guess it just depends on what time frame you want to trade and wether or not you want to trade and go make a casserole at the same time.:-) The author did make some very good observations, and it was definately worth a read.

    Thursday Trading 08/25/05

    Taking quick profits in this tight range between minor support/resistance this morning.

    Trades

    NEW Short at 43.55 covered at 43.44 and 43.40 +.11,+.15

    NEW Short at 43.40 covered at 43.21 +.19

    NEW Short at 43.17 covered at 43.25 -.08

    NEW Short at 43.27 covered at 43.17 and 43.08 +.10,+.19

    TOL Long at 49.40 sold at 49.58 +.18

    NEW Short at 42.98 covered at 42.85,42.81 +.13,+.17

    I'm seeing a lot of energy stocks moving up on my scanner today.

    Technical Breakdown


    Yesterday we had a pretty severe technical breakdown of the major indices.

    Watch these levels for further clues as to the market direction.

    Minor intraday support at 1210.50...next support at 1202.02
    Minor resistance at 1213.50 and 1216 area.

    Wednesday, August 24, 2005

    Wednesday Trading Wrap -Up

    After trading up this morning the SPU5 broke that support level at 1215.50 and is now resting on the second level at 1210.50. Next up is it's 200 day moving average at 1202.02 if 1210.50 does not hold. A break of 1202.02 and your guess is as good as mine.I would say 1189.50 will act as support next if we continue down.

    That move lower allowed me to pop off some more shorts in the afternoon session. The payout cycle returns. :-)

    Don't forget to check out the Trade-Ideas free trial through my affiliate link.

    Kaboom!

    Flush,rinse,look at that market go down. Good to be on the short side.:-)

    Wednesday Trading

    WLT short sell at 40.70 covered at 40.50 and 40.44

    New Home sales just came out, we could see some short squeeze in the sector today.

    Economic Data

    July durable orders fell 4.9%, well below economists' forecasts which called for a 1.5% decline, versus a downwardly revised 1.9% increase a month earlier (from +2.8%), while ex-transportation fell 3.2%...

    Mortgage applications fell for the seventh week in 10, dropping 0.7% in the past week, moving to 756.2 from 761.3, according to the Mortgage Bankers Association. The report adds to concerns that the all important consumer support, the housing market, is cooling. The purchase index fell 2.2%, but remains near record levels as interest rates are at historic lows, . Average 30-year fixed rates saw the first drop-off in 7-weeks, as rates fell to 5.78% from 5.79%. The average 15-year adjustable rate popped higher to 5.41% form 5.4% and 1-year ARM's tightened to 4.84% from 4.85%.

    SP 500 futures or (SPU5),yesterdays' low is at 1215.50,currently trading near that level pre-market.Next supports at 1210.50 and it's 200 day moving average at 1202.02... If the bull's don't take over this thing still has room to run down.

    I will be away for part of the day and be back hopefully around noon to check in on the market. Good Trading to everyone.

    Tuesday, August 23, 2005

    Trade Ideas : Stock Scanner/Watchlist

    I have a new (affiliate) link for a 7 day free trial to Trade-Ideas.Be sure to sign up by way of the link.For the readers who have never seen or heard of Trade-Ideas let me explain. Trade-Ideas offers a stock scanner that sifts the entire market for opportunities throughout the trading day,in real time.There are two versions available for the scanner,either through a browser window that continuously refreshes or via Trade-Ideas Pro which is a downloadable version. I personally prefer the downloadable version because of the ease of use,extra screen space,and the price remains the same, unlike many other vendor upgrades.There is also a sharing function in the Pro version that is very cool if your involved in swapping scans with other traders.

    To find stocks to trade in real time throughout the day,you can either use the preset scans,and still make any changes that apply to your own trading criteria, or you can make your own scan definations choosing from the scans they have available,and change a variety of criteria,ie: Min/Max Volume,Min/Max Price,Min/Max Gap Up/Gap Down etc...

    One of my scans for shorts on the NYSE.
    You can go to the link and choose configure in the menu to view all the different settings.This scan is set for minimal criteria, and I have also added a list of the NYSE Pilot stocks(shortable on downticks).You probably won't be able to see the list,but if you need it go here.

    I started with the free trial,and got hooked immediately.I am still in the process of playing around with the settings,but for the price it has been totally worth it,and it's payed for itself 10 times over.I will try and write about some of the settings in a later post. Do keep in mind that no scanner will make you money unless you still apply your own rules of trading.It simply offers a greater chance of opportunity so the trader can focus on the task at hand.

    I originally found this scanner through TraderMike,he had been using the sample scan through his daily Watchlist section.He is offering a two week free trial, so if your interested by all means hop over there and give yourself an extra week of tweaking the scanner.If you've already decided sign up here and get started.

    Thin Trading Today

    Volume is still lackluster today even with that move off the lows.I just don't see the volume. TSA has been trading over it's weekly resistance today, again I just don't see the volume for a substantial move.This one might be worth keeping an eye on though,it's just very thin for any daytrades.

    Day 2 of The Payback Cycle

    I'm playing stocks very cautiously for the remainder of the day.The payout cycle continues for the second day. Basically I'm flat, and I will only trade prime setups.Volume is very lackluster so be careful.Morning range has finally been broken on the SPU5 now trading at below minor support of 1217.10. Good trading all.

    Monday, August 22, 2005

    Today's Trading Re-Cap

    Today's trading,volume seemed to be lacking,the servers went down briefly for my connection to the market,and I had to leave the market early to take care of some things.I did find myself struggling a bit today,like pulling a rabbit out of a hat,if there's not one in there then your never going to find it.The day started off having several large winners,only to see them evaporate as the day progressed.Here's a list of mistakes I made today:

    Mistake #1: Buying a puppy,and telling my wife,oh sure no problem she can just stay home with me.:-) Just Kidding (But we really did buy a puppy,ughhh.)

    Mistake #2:(This is for real) Over-Trading when I could tell the market was lacking volume.

    Mistake #3: Going long when I had already stated this morning,how I felt the bulls could not sustain things.Trading against my own gut feelings and technical analysis."Trust your own judgment."

    Mistake #4: Continually trading the same stock,when it keeps taking money."I know I can beat it,I know I can be it".

    Mistake #5: Breaking all the rules I apply,that keep me from making mistakes number 2,3,and 4.

    Now, I could just blame today on the servers going down,but that would just be trying to justify some really poor trading. Nope I take full responsibility for this one.Don't worry the damage was minimal, only ended down -100.00 with commissions.Every good trader has his/her bad days,no-one is invincible in any market.That is most often the result of losing focus,and not obeying your trading rules.

    Just Keeping it real!
    Losing is no fun,but writing about it is even harder!


    Realizing I could also be in a payback period,I will scale back temporarily,until my conditions change.This does not mean withdraw,just scale back slightly,trading only prime setups.

    I also like to re-acquaint myself with the bigger picture of things when I lose focus,here's a couple of good readings for that:Online Trading,Random Roger,and Trader Mike.One more from Bo Yoder on the payout/payback cycle.

    Longs Weak Today Thus Far

    I've been trying to play a few longs today,but there is just no follow through.Had ALO for a .40,and .50 cent winner twice only to evaporate into a .20,and .30 cent winner on both.Have to take those profits faster today.The bids just aren't sticking.Bull's I'm dissapointed in you,that's all you have!I'm keeping my bear costume close just in case.

    Monday Trading

    SPU5 has a downtrend line at 1233.86, need to see some follow thru above that to believe the bulls.

    Negative Tone?

    I just don't buy into the whole bull theory right now.I'm hearing quite a bit of negative tone to things this morning,other than the Google news. We'll see what the market has to say today.I just don't trust the bull side of it all.

    Sunday, August 21, 2005

    New Addition To The Family


    Well, I now have a new trading partner,and a new addition to the family.Hmmmm,what should we name her.Taking suggestions. :-)

    Saturday, August 20, 2005

    Trading Style

    My trading style is somewhat similar to that of a scalper and a momentum trader.I am very big on reading multiple time frames on the charts,but not entirely dependant on that. I will also look to the nyse book to determine the depth of interest in the stock for the time periods I am trading.When I started out I was only looking at the charts,then I progressed into reading the nyse open book,and now I am using a combination of the two.

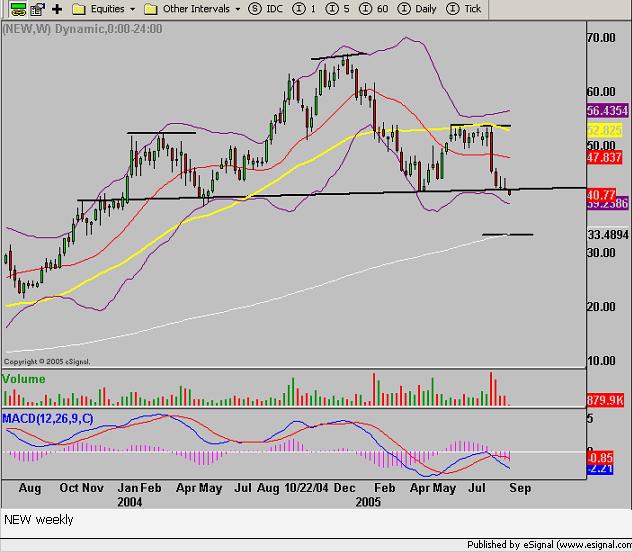
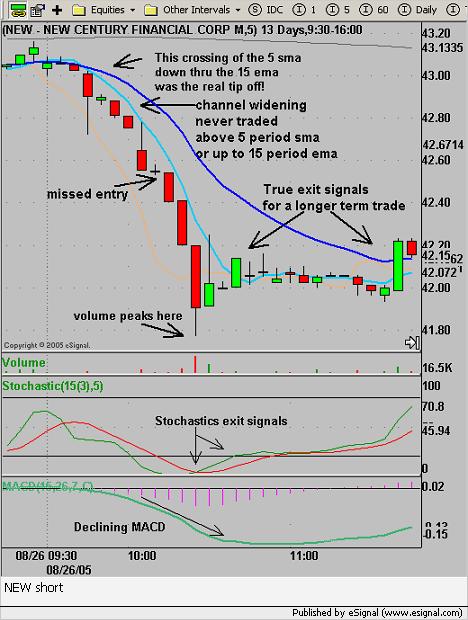
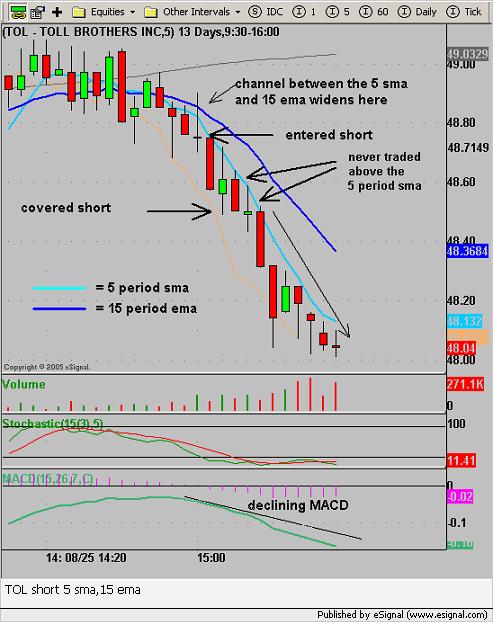
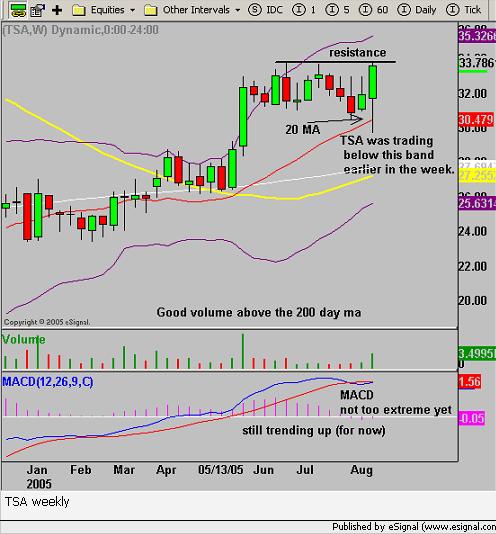
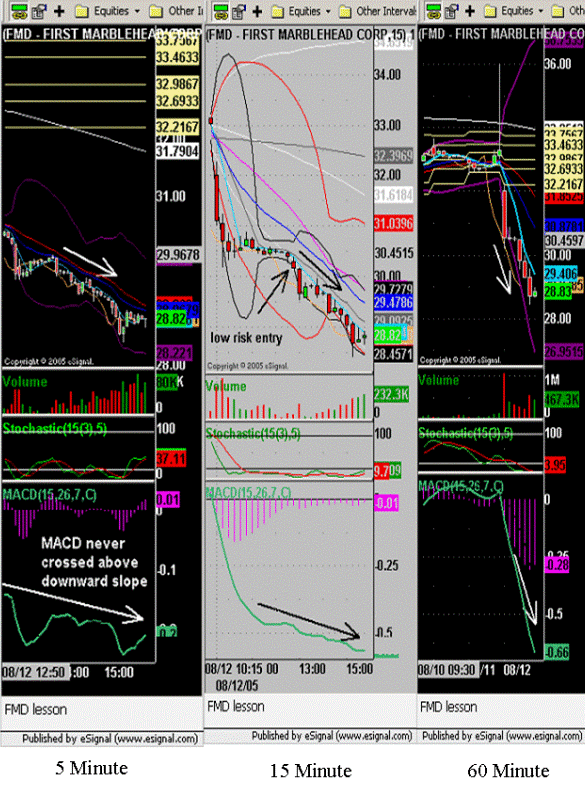
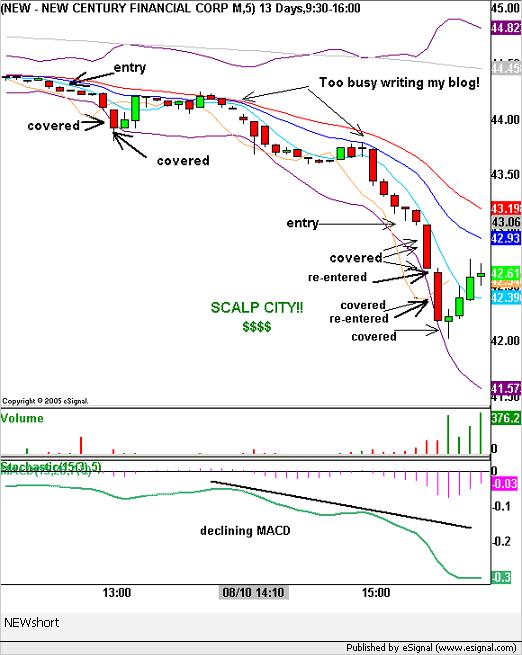
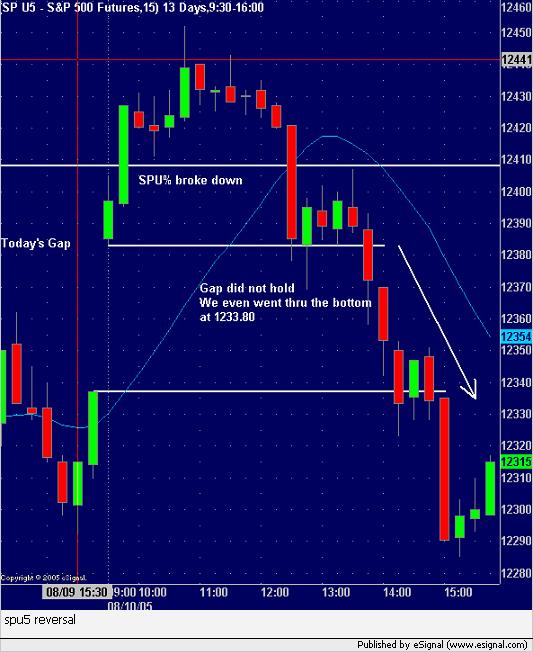
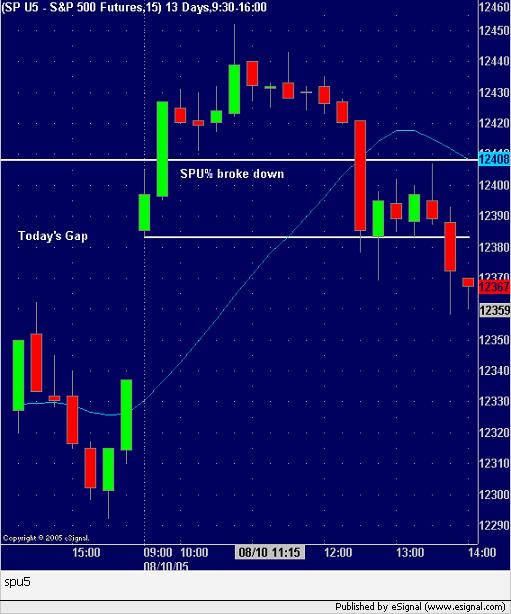
    On the charts I am mainly watching 3 time frames the 1 minute,5 minute,and 60 minute.I will look to the daily and weekly charts from time to time just to locate major points of support and resistance where stops may be run through and volume is likely to increase, but they do not play a huge role in my strategies.Basically it is a top down approach setting the daily and weekly charts aside, I start with the 60 minute looking for pivot points of interest,then move down to the 5 minute for confirmation of trend,and finally the 1 minute for entries.I will also watch the MACD line for trend and slope,and pay attention to the stochastics for trend and turning points.Moving averages also come into play when applicable.I use a 20 period from the bollinger bands, and a 5 period,and 15 period through all time frames.My main focus on those is the 5 minute,and 15 minute charts.If I'm really focused on the moving averages I will turn to a 6 minute,and 13 minute chart,but that's a whole different post in itself.

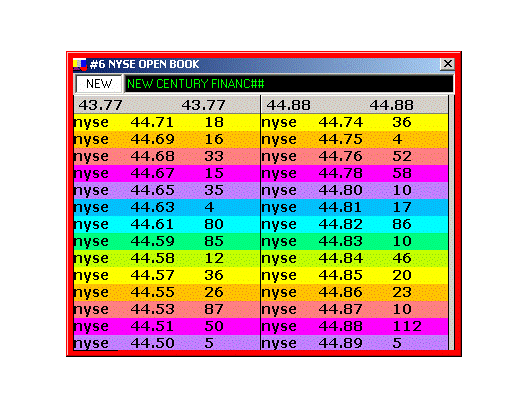
    Now I look in the nyse book for orders moving up or down,holding price levels,or a discrepency in share size on the inside bid or ask of the book,compared to the inside NYS on the level 2 market maker box.Confused yet! If the orders don't match between the book and level 2 on the inside bid/ask then you have found the specialist!

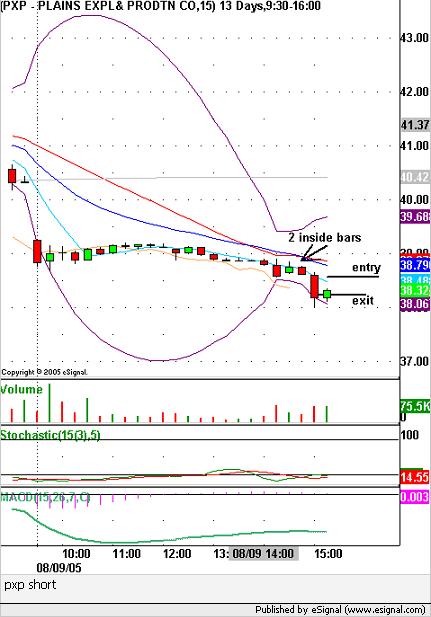
    Example:The inside bid of the nyse book shows "nyse 1000" shares, you look over to your level 2 box and see "NYS 8000" that means the specialist is bidding 7000 shares more than the limit order of 1000 shares that is in the book.The specialist may have more shares than is showing,but we never really know that,all we can do is act on what we see at hand.Now if I see this pattern sitting at say 50.25 and the specialist moves up to say 50.28 and there are 1000 shares at 50.30 on the offer I will take these shares out(buy the offer)since I have the specialist "walking the stock up".I also want to see that I have some shares behind him still in the book say back down at 50.24 and 50.22 and maybe some ARCA orders in between.I always want to have an exit.The specialist can create a powerful move and at the same time pull his entire order.Always make sure you have a backup plan to get out.In other words make sure there are enough shares to exit on depending on the size of your position and what's in the book.Now,back to the trade that is moving in our direction,as the specialist walks up you want to see additional offers be bought or you may decide the trade has real momentum and take the shares out yourself,just make sure you still have the specialist at your back.As he walks the stock up additional offers will be taken out,once you get a substantial move which will be determined by your own risk/reward targets you have to decide if it's time to start pairing out of some shares.This may also be decided by the charts,maybe there is a previous resistance or pivot point that the stock is approaching.If the specialist is starting to lose shares it may be time to take some off the table.Continue to monitor your exits behind the specialist,ask these questions,have the orders behind the specialist moved up in the book,have additional orders come into the book,or have the bids really thinned out?The book has a slight delay so you really have to pay attention,if your other exits have all dissappeared it may be time to exit the entire position.The rule of thumb is,if you still have the specialist on your side then you should still be in the trade,easier said than done.When your looking at a .25 to .50 cent profit it's hard not to want to take a little off and book some profit,but you should really keep some shares if the specialist is still there,because you never know when they might run it up hard and give you a stick(1 point) or more. Always know your out/exit,I can't say this enough,it will save a lot of pain,and money,and shorten the learning curve in the long run.This whole process can be repeated for shorting stocks. There are a lot of different factors that I also consider throughout the trading day,concerning time of day,volume,geopolitical factors,OIL,etc..., that's another post.

    My main philosophy is be consistant,manage your risk tolerance levels,and enjoy what you do! Take consistant profits,small losses,and always be focused.This style of trading may not be for everyone,but it really is a combination of many other styles.My one hope is that you can take a small piece of this,integrate it into your own strategies,and profit from it.If you are new it is a great way to learn.Start out by watching for the specialist in many stocks over and over,until it becomes second nature.

    For other strategies see TraderMike and Daily Dopeness,and also TraderEyal,some good reading at all of these.

    Good Trading!!!

    Friday, August 19, 2005

    The Sports Authority : TSA


    TSA traded to 33.76 today after some wild swings.Opened at 33.00 traded down to 32.22 then traded back up through the open to the weekly resistance line of 33.78. Well .02 cents shy of it anyway.With the combination of options expirations and earnings I'm sure that made for a wild ride for some.Notice on the weekly chart TSA made a recovery through it's 20 period MA and is now trading back up towards it's upper bollinger band.I think it still has some room to go if it gets thru this 33.80 level and holds.Might make for some good intraday plays next week if the volume keeps up.Be careful though,that thing can have a nasty bite if your not nimble on the keys.
    I did manage to squeeze a small scalp out of it today: Long at 33.13 ,sold at 33.30 and 33.39 . We'll see if this thing can get through this weekly resistance or not next week.I have it on my Trade-Ideas scanner set for 5 minute highs/lows, 15 minute highs/lows, and 60 minute highs/lows. If it offers up some volume next week I just may bite either way up or down considering it is on the NYSE Short Pilot List.Keep in mind it did have earnings today,which will always create more volume than usual and some vicious swings.The trade I took in it today was a very close prime setup,but I did have some other factors in the NYSE book setting the trade up for me.Good trading to everyone!

    This post is in no way suggesting a buy or sell,I'm simply looking for good scalping opportunities with volume that fits my own criteria.From time to time I will look at the weekly charts to do that.

    Friday Trading : Options Expiration

    I will be doing very little trading today if any as I believe other good traders will be doing the same.The markets are very quiet right now and it is options expiration.Between that and low volume it's a recipe for very treacherous trading. Yes I'm playing it very defensive this week,it's capital preservation week for me.If a prime setup arises I will take a trade otherwise it's an early weekend.Good trading to everyone!

    Thursday, August 18, 2005

    Trading Journals: Heat Map


    Reading the previous article on trading journals,which I found through TraderMike,made me think about my own method of tracking my progress.I could relate to the article especially the part about tending to focus on the winning trades so that you can reproduce those patterns.The above pie charts contain the percentage each individual stock holds as either winners or losers.The color coding denotes each individual stock and it's percentage of the graph.The stocks are listed next to the graph on each.My top traded stock this month has been NEW(In the chart it only has an "n",but should be"NEW").That is the stock I have been focused on trading intraday since it has been proven to be a money maker.The others are just icing on the cake,which by the way I believe were mostly caught on the Trade-Ideas scans.This tells me I want to keep my focus on NEW until I see that it's not trading the same patterns.Now over to the losing stocks,yeah this is the part we all hate.These are the stocks that I have lost in when traded and will tend to stay away from since they have not made me money.To be honest these are stocks that did not fit my criteria 100%.The losses were minimal on average only about .03 cents,but they still have to be acknowledged.Realize why you made bad trades and move on.Focus on the winners.The pie chart is a very good heat map to your trading progress and where you should focus your efforts.

    Good Reading

    Here's a great article on trading journals I found thru TraderMike.Since I use this blog as a form of a journal posting some of my better trading patterns,that article was my favorite read.

    Technical Problems

    Wow, what a day,I've been having some technical issues with the systems here at the home office.I apoligize for the lack of posts today.One nice thing about trading at an office is the technical support that's usually provided,but I'll still take trading at the home office over that.Just waiting on the tech to come out now.It amazes me how some of these providers get away with the over the phone "tech support" that they offer,I'd love to mention there name but I won't.Some of these people just have no clue,like there reading from a script or something,well that's the "advantage" of outsourcing isn't it! If you couldn't tell I'm a little ticked that I have to spend my day waiting on someone instead of trading. :-) Trying to stay positive though.Good trading to everyone,I'm on a mini vacation for now I guess.

    Opening Range

    SP 500 Futures opening range for this morning is 1220.00 to 1217.40

    Thursday Trading

    SP 500 Futures now trading below 50 day moving average of 1222.45.

    Wednesday, August 17, 2005

    Correction To Daily Chart of S&P 500 Futures

    Yesterday I posted a daily chart of the S&P futures which was incorrect,my apoligies.I stated that yesterday's candle was a gravestone doji,which for some unknown reason appeared in my charting software as just that.Turns out today it shows up as a candle which opened higher and then traded down to close at the lows.Still a bearish candle and still closing on the 50 day moving average,just not a gravestone doji,but we did get that gravestone doji which formed today "if" my charting software is correct.

    I hope this clarifies the matter for anyone who noticed.

    Wednesday Trading


    ...and the dullness continues! My rules are keeping me out of this market for now. I'm not into these low volume whipsaws. I've been out running some errands, visited a friend at the old trading floor,man was it quiet! I thought it was me,but there is just very little action out there right now.Trade with caution.If your going to play this market trade only the prime setups and stay away from the whipsaws.

    Tuesday, August 16, 2005

    Daily Chart of S&P 500 Futures


    Ok, I really hate daily charts,but I wanted to share this.

    Yep, looks like a gravestone doji to me! These are a bearish sign, but keep in mind that it closed right on the 50 day moving average,this could act as support.

    Just some observations.

    Where are The Big Boys!


    I didn't see much institutional action today.
    Seemed mostly like retail players.
    Just a thought,I don't make market calls,I'll leave that up to the "smart" guys.

    I smell a bear!!!

    GS on Downscan


    GS was on the Trade Ideas downscan, made a nice run.I missed my entry on it though.
    Showed up on the new 60 minute low, set for NYSE Short Pilot List,you have to create this list in the configuration.Min. stock price set at 20.00 and min daily volume set at 300,000.It's already run quite a bit so I wouldn't short it here.

    Just a Post

    This market is comatose today,zzzzzz.Where did everyone go,sure wish I was invited!

    Morning Volume

    Volume on the NYSE is about 5% below its three month average at 11:30am.
    Volume on the NASDAQ is about 10% below its three month average at 11:30am.

    Info from Trade The News.

    Tuesday Trading

    The market is still lacking volume today thus far. I managed to pop off a couple .15 cent winners in NEW but that's about it right now.Considering those were pretty heavy down bars in the SPU5 and nothing really budged too much I will remain cautious until volume picks up.This 1228.00 area in the SPU5 will most likely act as minor support for now,until proven otherwise.Trade with some caution here.

    Trade-Ideas/Watchlist:Scanner

    I've noticed the mention from TraderMike about the Trade-Ideas scanner this morning.I've just started using it and have had a few winners from it.I'm trying to set the scans so they accomodate my trading style and then apply my own criteria to the trades that show up.I have had some success and I am still trying to maximize my use of the scanner.One setup I have is for the NYSE Short Pilot List,I only trade NYSE so I have the settings to only scan this list for stocks moving down,the criteria for these will vary upon personal preference,but they have a wide variety of choices.If your trying it out good luck, and if anyone has any suggestions I would like to hear from you.Good Trading!

    Monday, August 15, 2005

    Prime Trading Setup:Intraday Example


    The above is a good example of waiting for prime setups.The 5 minute chart on DKS shows that MACD was sloping down.MACD was sloping down on 5 minute,15 minute,and the 60 minute charts,Three Lane Highway!I also had large orders come into the book behind my entry making my risk very small about .03 cents.This trade was taken off the Trade-Ideas scanner.It is also on the NYSE Pilot Short List.Patience and discipline pay off.Original short entry at 38.82,covered at 38.69.Second short entry at 38.69,covered at 38.44.Good Trading.

    Tip of The Day!

    If you don't want to get mugged stay out of rough neighborhoods.

    In other words if your trading setups aren't there then don't force it,and don't go looking for trades where your not familiar with the patterns.Good Trading! :-)

    Low Volume Monday

    Volume is very light out there today.I'm seeing a few setups,but very thin volume.My rules are keeping me out of most trades,one of those being I like to know where my out/exit is,and the volume just isn't there.I may just have a day off here.I noticed a few others sighting low volume out there also.

    SPU5 is in a very tight range 1232.70 to 1228.00
    I don't see volume coming in unless we break that range.

    Sunday, August 14, 2005

    Trading Prime Setups


    When looking for trades it can sometimes be overwhelming especially for a new trader.There is so much information to take in at once it can throw you off your game if you let it.Every trader should have a planned trigger for both there entries and exits.That may be a certain indicator or set of indicators that tells the trader this trade has potential,if this happens then I will do this.For example, I use the MACD for trend, and the trade with the most potential is when the MACD is sloping in the direction I want to trade on the 5 minute,15 minute,and 60 minute charts.I want to see this on all three charts for a prime setup,otherwise known as a Three Lane Highway! I will give the 60 minute chart a little room for instance if the 5min and 15min are sloping in the same direction and the 60 minute is just starting to turn,I still consider that a prime setup.Now if any three of these are diverging then this is not considered a prime setup and only experienced traders should take these as a trade.The indicators will vary from trader to trader,but the concept remains the same,for new traders or even if your a seasoned trader in a slump it is always best to wait for the prime setups and build consistency.Look for your indicators to line up in the same direction over several time frames and before your entry always know your out/exit.The above chart gives a good example of how MACD was sloping downward over all three time frames producing a great setup for a short position.

    Saturday, August 13, 2005

    Finding a Trading Coach


    The other day a reader asked me about coaching and my reply became quite long so I thought I would just make it a post for some additional reading.I've added a couple of points to the original reply.

    Here is my reply:

    As far as training/seminars I personally think there a waste unless they are actually hands on.Keep in mind I don't know your background,but my suggestion to you would be find a trader that will let you sit and watch,or trade side by side with them for a length of time,two to four weeks at the least.If it's a certain "style" your looking for ask yourself what fits your personality,are you patient,impatient,laid back,or highstrung,and so on.What is your time frame, do you want to swing trade over several days/weeks,range trade intraday,or scalp intraday.Scalping is very hands on and may not be for everyone,but if your new to trading I highly recommend starting out as a scalper. Decide what style fits you best,find someone that trades that style "profitably".I trained in a room of about 20-25 traders and found out who the most profitable ones were and learned from them.My first couple of months involved one on one training, I highly recommend this route.

    Friday, August 12, 2005

    Trade-Ideas

    A quick note about the trade-ideas scanner/watchlist.One nice feature is that you can configure it to only look at either selected stocks(your own list), or you can set it to only show NYSE shortable stocks.I'm still trying to find out if thats just shortables that are available or stocks from the NYSE Short Pilot List,either way you can make your own list,and just add those stocks. I think that's a very powerful edge especially on down days.I have two windows open at once,one for upscans and one for downscans.Hope this helps some NYSE traders out there.I'm still trying it out,but so far I'm impressed.

    Low Volume Friday

    The market is pretty stagnant today,we're in a fairly tight range.Not that it couldn't change,but I've decided to step back a little here.If you've had a good week already,it may not be a bad idea to walk away or at least decrease the amount of trading.Unless I see something significant,I will be doing just that.If you have not had a good week or you have struggled it's never wrong to take a small break.Ending your week on a bad note is no fun and then having it consume your weekend will not help you prepare for the next one.I think it's better to step back,and give the body and mind the needed rest.Most people think trading is an easy job and not considered hard work,but we as traders know that is an illusion.Trading, I would say is one of the most demanding jobs to hold,as we use our minds constantly deciphering a flood of information,this can also take it's toll on the body.It is not to be taken lightly,and both your body and mind need to be at there peak at all times.Soultrader has a good read on "getting the mind right". I found this site via TraderMike.I've had a great week,one of my best one's,and I'm not about to give it back by trading when the trading just is not good.Good trading all,and enjoy your weekend!

    Thursday, August 11, 2005

    NEW Daily Chart


    This is the daily chart for NEW.I don't usually post the daily charts because my time frame is so short,but I thought this one was definately worth sharing. This better explains why I've been so concentrated on NEW the last few day's.It's showing a little support on the weekly chart, but if this thing takes out the lows again it will be a free for all, of course I expect it will either bounce or consolidate before anything else,either way I will be prepared.Today was a small inside bar, the volume is good for offering up a few good scalps.

    Trades and The Market

    Today only offered small scalps, good day for the tight range we were in.

    NEW Long 42.70 Sold 42.97 +.27

    NEW Long 42.89 Sold 43.19,43.25 +.33

    NEW Short 42.91 Covered 42.76,42.67 +.20

    FAL Long 23.60 Sold 23.67 (no follow thru) +.07(missed the 23.80 to sell)

    WLT Short 41.97 Covered 41.82,41.78 +.17

    NEW Long 43.16 Sold 43.30 (reversed hard right after exit.That was close.) +.14

    Posted from 10:21 am
    We could be range bound today, seeing a lot of moves,but no follow thru.We shall see.

    SPU5 minor resistance 1241.00 next resistance 1246.50 and 1248.90.

    SPU5 minor support 1233.80 next support 1228.50 and 1226.50.

    FAL

    FAL just hit my scan long, see if it can get over 23.70.Kind of thin.Just scalping it.

    13:59:00 Nope it's not doing it

    FAL Long 23.60 Sold 23.67 ( I missed the 23.80,looked like it was really going for a second there.)

    I'll keep an eye on it, but things are really lacking follow thru today.

    The markets pretty quiet today, I think I'll take a step back.

    Energy Stocks

    Looks like the energy stocks are on another tear today.Well some of them anyway.TXU up again.

    Tip of The Day!

    In this section I will write short snippets of my own rules,beliefs,and instruction on trading NYSE stocks.No this is not a section on "stock tips".:-)Just my own personal thoughts.

    Today's Tip

    Never take a stock tip!Haha

    Ok I'm just really bored, better get back to trading.

    Wow what a bounce in NEW, guess I should have got long,oh well.:-)
    Hope nobody took that short, remember I would only get short on it if it took out the 42.50.That's how rules keep us safe.It would have been a great long though when it reversed,darn!

    NEW


    Watch NEW here we could break the 42.50 level and take a shot at yesterday's low of 42.02. Wait for confirmation (Large orders coming down and good size prints on the bid). We might just bounce off it if it does not go thru that.This stock has kind of been consolidating today,so be careful and be patient.

    12:48:00 There is a large TRIM at 42.50 along with large nyse limit order so if you short wait for some to be taken out first. At the same time there is a large order at 42.60, so if that gets taken out first we could bounce, well it just got hit as I write.I don't expect much of a move though.

    12:54:00 This things trading very erratically right now, best to leave it alone for now.

    Update


    We have just broken thru that minor support area I spoke of previously.Watch the next area.I would be cautious putting on any new shorts until we take out the next support.See previous post for details.

    NEW Short

    NEW Short 42.91 Covered 42.76,42.67

    Just scalping this market, taking quick profits here.

    Still rangebound sitting near support,stated in last post.

    Wednesday, August 10, 2005

    NEW Shorts:Update


    NEW really got clobbered today.I took quite a few trades in it as you can see,maybe it would have been better to hold it all the way down,some would say,but I don't mind the scalping.I had MACD trending down on all the trades on the 5 minute and 15 minute charts,and just starting to turn on the 60 minute chart.Every entry I had a minimal risk of only .03 cents. I had trend,MACD,and large orders stepping down, the three things I always look for when taking trades.Also the SPU5 was breaking down.I didn't point out every trade in the chart since there were quite a few.Nice to have a stellar day when the markets crumbling. :-)

    Gap Reversal Followed Thru:Filled the Gap


    The gap up did not hold today, that looked pretty nasty.
    Hope all were on the right side today.
    I guess my gut was right this morning I'm always a little suspect of those gap ups that drift without much behind them.

    Reversal of Gap Up


    This is a 15 minute chart of the SPU5 today.As I stated earlier there was a gap support/resistance line and it has now been broken. This is a minor line from previous gaps.We've also broken the top of today's gap,could be range bound here.Todays support at bottom of gap at about 1233.80.

    NEW Short

    NEW Short 44.28 Covered 43.98,43.95,43.89
    Nailed that sucker good this time.
    Would have covered the low, but NYSE would not fill,bunch of crooks.
    Nothing like watching a bunch of orders get filled below you!!Still got my piece though.I'll review the trade later today, I might be done for the day now.We'll see. :-)

    NYSE Open Book: Basic How To


    This is the NYSE Open Book for my trading software. Without getting into too much detail here it shows me the depth of the market for the individual stock as far as the nyse limit orders are concerned.It is split into two sections of data,the first being data for the Bid,and the second being data for the Ask.Ignore the grey areas that is just level 1 data.
    I will start from left to right and describe each column as column 1,column 2 and column 3.I will do this twice for both the Bid side and the Ask side.

    Column 1 you will see the nyse label,that just means there is a nyse limit order there.(If you change the settings you can also see ARCA,ISLD,and so on, but we don't care about those right now.)

    Column 2 you will see the best bid price in this example it is 44.71.

    Column 3 you will see the number of shares being bid, in this example there are 1800 shares being bid(I am very visual and only like to see the 18,add the 2 zeros on in your head.For myself this gives me a better visual perception of the differences in the depth).Most software you can show the entire 1800 if you like.
    Looking down in the book you will see the different price levels, hence the depth of the book.

    Now repeat columns 1,2,and 3 in the right half of the book and you have the limit orders for the Ask.

    The orders will come in and out of the book as the stock trades,when I post my trades I will often say big size came in at the bid or offer,when I say that I just mean a large limit order came in. I will also say size stepped up for longs or size stepped down for shorts,there I'm saying that they came up or down a price level in the book.

    This is just scratching the surface of how to read the nyse book.I will explain the correlation of the nyse book and the Level 2 (marketmaker w/time and sales),how to spot the specialist,and how to spot floating orders, in another post. For a small fee ;)Just a joke.

    If you have any questions feel free to comment.

    Gap Up

    The market has gapped up over a minor gap support/resistance line at about 1241.00 on the SPU5(just a trend line I've drawn from some previous gaps).Next resistance lies at 1246.50 and 1248.90 is the 52 week intraday high.I never really like these gaps higher that develop into a slow drift, makes it hard to scalp,but we'll see what the remainder of the day brings.

    Trades today:
    NEW Short 44.53 Covered 44.40 and 44.38

    NEW Long 44.49 Sold 44.61 and 44.70

    NEW Short 44.73 Covered 44.58 and 44.50

    CI Long 112.02 Sold 112.20 (should have held that longer!)

    CI Long 112.28 Sold 112.58

    NEW Short 44.28 Covered 43.98,43.95,43.89

    NEW Short 43.91 Covered 43.76

    NEW Long 43.61 Sold 43.77

    NEW Short 43.06 Covered 42.91,42.88,42.67

    NEW Short 42.62 Covered 42.40

    NEW Short 42.39 Covered 42.10


    I've got a "how to" on using the nyse open book coming up shortly.It will be good for anyone just starting out or not familiar with the nyse book. A reader requested some info on it the other day.

    Straight Forward


    I was looking at some other blogs today and I found a post that really stood out. It's called Balance, it is very straight forward and to the point.I could not have said it better myself. Everyday I strive to approach the market in this way.

    Tuesday, August 09, 2005

    Blogger Maintenance Tomorrow


    Maintenance tomorrow

    We will have a downtime of one hour tomorrow at 6pm Pacific Time. Apologies for the extended maintenance - we're using this opportunity to perform a major database upgrade.

    – Jason G. [8/09/2005 10:34:00 AM]

    I apoligize for the inconvenience, hope I'm still here when they finish.
    Just Kiddin' around :-)

    PXP Short:Chart


    PXP showed up on my downscan.I took it short off a break of the 2 inside bars pointed out on the chart.I only had a risk of .04 cents, with plenty of orders behind that in the NYSE book.PXP was also making a new low for the day with a little downside help from the SPU5 futures.MACD was trending down on the 5 minute and 60 minute charts, my entry was based off the 15 minute chart.I missed a little chunk of the move, it was one of those quick downthrusts.Entered short at 38.57, covered at 38.25 for a +.32 gain.

    Trade : PXP Short

    PXP Short 38.57 Covered 38.25
    Covered a little early, still a +.32cent winner
    PXP was making new daily lows
    MACD was turning down on 5 minute and 60 minute charts
    SPU5 was headed down also.
    I'll post chart soon.

    Scalp

    NEW Long 44.98 Sold 45.13 and 45.19

    There is a pivot point up at 45.26 so I would not expect to see much more to the upside on NEW unless it clears that.

    Radar:Update

    AGN took off to trade up to 91.89
    My timing is way off today
    AGN Long 91.60 Sold 91.67
    Very tricky to trade today

    Radar

    AGN might be worth a look.
    I missed it at the whole number 91.00
    We'll see if something transpires.
    It's making new highs today.
    Very thin though.

    Back and Forth

    The trading day thus far is pretty sloppy action.
    I'm backing off while I'm ahead, not worth the fight.
    Waiting to see if we fill this gap in SPU5(1230.55 - 1225.25) or go higher.
    Just rangebound now not a good environment for my style.

    Fed Day Today / FOMC Policy Announcement

    Fed meets at 2:15 today.(Policy announcement,expected .25 basis point rise in rates)
    Productivity rose at a slower pace
    Wholesale Inventories due at 10:00am

    I don't expect to see much action today. Some traders are choosing not to trade today.That's not a bad idea, considering Fed day is usually uneventful leading up to the announcement and very volatile right after the announcement. If you are going to trade today do it with caution. I make it a rule not to trade 15 minutes before and 15 minutes after the announcement at 2:15.
    Trade at your own risk.

    Monday, August 08, 2005

    Follow Up On CI Trade From Today

    I've gone over that trade and really can't justify staying in it any longer than I did. I caught it on my scans after it had already moved quite a bit, so I waited patiently for a good entry. While waiting I noticed the specialist selling and decided to go short. I had MACD trending down, and I knew there was still some of the gap to be filled.My reason for entering was the specialist selling, and once that reason left that changed the look of the trade for me and I had to exit. I like to see the specialist step down a little more than he did,with more orders behind him than there were.This one just kind of drifted it's way down to fill the gap. Can't do much more than follow your rules and move on.The rest of the afternoon was pretty uneventful as I thought it would be.All in all it was a good day for some scalping here and there.FOMC meets at 2:15 Tuesday.

    NYSE Pilot Short List

    Here is the list of NYSE stocks that no longer require an uptick to sell short.Of course you will still have to check with your broker to see if the shares are available to sell short,but most trading softwares should have that implicated into there own system so that if it's not available for shorting it won't let you place the order.

    Crude Oil

    Crude Oil closes at highs of day; unofficial close of $63.85 +1.54

    Radar:update

    CI gaining some offers now with specialist
    13:33:54 CI short at 109.86 current

    13:36:35 Just covered some at 109.67

    Specialist at 109.75 now ,he leaves I leave
    Looking kind of thin here

    Specialist gone for now
    13:47:30 covered remaining at 109.76

    Well it was a good call but I let go of that to soon,my amount of risk was widening and the specialist appeared to be gone.
    Great entry bad exit, although I still profited, I did not capitalize.
    CI just printed 109.21, gotta love when that happens,arrrgh.
    In my previous post I said CI had a gap to fill at 109.18, this is a time when I hate being right.I'll have to disect this trade later and see where I went wrong.Although I have to follow my rules, and they will keep me out of good trades from time to time,they also keep me out of the bad trades.

    Radar

    Keeping CI on my radar, waiting for something significant before taking short.
    Missed the good entry at 110.14 so I'll wait.
    It has a gap to fill around 109.18.
    This stock is on the NYSE Pilot Short List.
    I'll post a link soon.

    NEW Trying It Again

    12:26:15 NEW short at 44.53 current
    needs to break this 44.35 here or it's not going
    12:35:15 Covered 44.36 and 44.26
    Again no follow thru, taking quick profits

    Scalping Mode

    Looks like I'm in scalping mode today. The way I see it today is that you have to take your profits quickly. That's why taking some shares off for a .20-.25cent winner is not a bad idea,at least in the nyse stocks with the action I'm seeing.Unless the SPU5 breaks the 1227.50 area I would be very cautious with any shorts here. If we get a move below that the momentum down could pick up a little,but I still would not expect much before tomorrow.

    NEW Short

    11:12:51 NEW short 44.70 current
    new lows
    11:19:00 covered half at 44.36 covered remaining at 44.51

    not much follow thru today, have to be quick and nimble
    That's why I covered half, shares get blown out real quick on nyse when volume is light like it is today.

    Market Action

    Playing the market cautiously today. With the FOMC announcement tomorrow at 2:15, I expect there could be a lot of indecision in today's trading.Just testing the waters this morning.

    NEW Long at 45.10 Sold at 45.31

    Saturday, August 06, 2005

    NYSE VS. NASDAQ Part 1


    The story behind why I trade only NYSE stocks as opposed to Nasdaq. Ok I have traded Nasdaq before and to be quite honest I didn't do very good. There were good times and there were bad times, but no real consistency.I first started trading Nasdaq as a newbie,and believe me I was definately a newbie and a sucker.I commited every mistake in the book like selling the bottoms,buying the tops,averaging down, holding on to losers and so on.The question is was it the market commiting these devastating blows to not only my trading capital,but also to my self-confidence? I can now answer that with a resounding NO!
    The market does not do anything to us as traders or investors, aside from the few shenanigans that were going on.The market is nothing but an ever repeating process of our own human behavior,aside from the program trading which even in that case often capitalizes on,once again,our own human behavioral patterns.We create the fear and greed that constantly pushes the market to a new high or a new low,we create the same emotions that cause the market to be rangebound or in a trend.The market is incapable of doing anything to us as traders or investors,it is our own perception of the information given to us that creates the market,any market for that matter. Equity markets,Bond markets,Real Estate markets,Commodities,even the corner fruit market down the street.They all come down to one single factor,human behavior.What are we willing to pay for this or that,and what are we willing to take for this or that?How much risk are we willing to take on a certain transaction?Supply and demand!Fear and greed.It comes down to how we perceive it all as individuals.
    As for my own individual perceptions on the markets I tend to lean to the NYSE equity market.After I got beat up enough in the Nasdaq markets, I came across a forced awareness,not that it was the markets fault,but my own and I needed to find help if I wanted to stay in this business of trading.A friend of mine suggested I go out to Houston,that I could be coached in trading,he obviously had enough confidence in my trading skills to help me out and point me in the right direction.So I picked up my things and hit the road,just like that.I have to admit,it was kind of rash and unexpected to everyone around me,but it was the best decision I ever made.I'm now married and trading from my home in Houston Texas and very happy. So it just so happened that this coach traded NYSE only,and would not let me touch a Nasdaq stock.It wasn't that the market was not good for me,it was that my personality was not good for that market.I learned all his strategies for trading NYSE,and learned an extensive amount of technical analysis from the traders around me.It took a little getting used to trading with the specialist and reading the nyse book,but it is a very disciplined style.I use a combination of technical analysis and reading the nyse book,and it seems I have now taken on a style of my own that fits my behavioral makeup.I would much rather watch one specialist on the nyse,than five marketmakers on the nasdaq.I have to be honest, I have not traded a nasdaq since,and feel no real need to.Some traders play both markets,some nyse,and some nasdaq. I personally like to keep my world small and focus on a few stocks.When I am not trading those stocks well then I will look for other nyse stocks to add to my list and take some of the focus off my usual suspects.I find with nyse I have a better idea of where I will get out if the trade goes against me.I find plenty of opportunity in the NYSE market, and I will admit there are times when either market is offering more than the other.I'm sure that eventually the nyse will change over to all electronic or some kind of hybrid model and I will have to change my perceptions.I believe that is happening at this moment.There really is no right or wrong market it will vary between different traders.I can apply a MACD to a nyse or a nasdaq and it will tell me the same exact thing, it's just that I perceive my own personality to fit better to the NYSE.I think perception is 95% of it, and these perceptions will determine the outcome in any market.The market involves continuous price movement, just as being a trader involves continuous learning and adaptability,that's what makes it so interesting.

    Time Segmented P&L / Updated


    Updated in reference to previous post, as of 8/6/05.

    The Trading Day: Breaking It Down


    This is a monthly bar chart of my P&L by time segment. It allows me to monitor a few different aspects of my trading. First let me explain the layout of the chart which is quite simple.The bottom axis is the time frame in hours.The bars are layed out in two part,the first light green bar being my gross p&l,and the second dark green bar being my net p&l for that given time period.The pattern is the same for negative trades except the color being red,I think we all know what that means. The colors from lighter to darker tell me if I am making real profits, or am I churning taking too many trades,and only running up commissions during that time period. My style sometimes involves getting in and out a lot, so I really have to monitor my profits to commission ratios.I can also look at this at the end of the week,sometimes twice a week,and determine at what times of the day am I benefiting the most.Also at what times of the day am I losing,and what times am I churning.Combined with some other factors it is a fairly good indicator of my daily progress, and helps me determine better when I should lean into the market,and when I should back off.It's also pretty consistant in telling me that there are usually three good time periods for my trading. Right now by looking at the chart those time periods seem to be after the first hour, until about noon,then the mid afternoon,and finally the last hour or so.These time frames of opportunity will change from time to time, that is why it pays to monitor your progress.Not all the work is done in realtime.Do your homework, that's how we become better traders, and make it all worth while.

    Friday, August 05, 2005

    Trades 8/05/2005

    NEW Short 46.77 Covered 46.54

    NEW Short 46.38 Covered 46.04,45.99

    NEW Short 45.60 Covered 45.35,45.38

    NEW Long 44.73 Sold 44.99,45.03

    WLT Short 41.50 Covered 41.30,41.29,41.25,41.21

    NEW Long 45.50 Sold 45.60,45.65,45.66

    NEW Short 45.40 Covered 45.27

    NEW Long 45.28 Sold 45.46

    Most of my trades today were small scalps.I will probably only post the WLT trade later today.Also I will try to post something about why I trade NYSE as opposed to NAS.Time to rest, and enjoy the weekend. Good Luck all,and Good trading. :-)

    Thursday, August 04, 2005

    NEW down -4.60 !!


    Nothing erks me more than to see a stock I regularly trade get hammered, in the direction I like to trade it! There I got that out of my system. Anyway one of my rules is not to trade stocks the day of their earnings, and the second rule is not to trade the first 15 to 20 minutes. Most of the move down in NEW happened in the first 15 minutes, would have been a gamble to take it at the open. I don't do gambling.Just grabbed .20 cents out of that dog! Sorry I'm a little emotional today.Time to call it a day! A profitable day is always a good day.

    Short Sell


    WLT was taken short off the 15 minute chart. The ninth bar of the day was a break of the prior four inside bars. MACD was declining on the 15 minute and 60 minute charts, and I had been watching the orders in the nyse book. The specialist was trying to hold it, once he left the bid they pretty much flushed it down. A combination of the charts, the book, and watching the prints produced a good trade here. Unfortunately I covered half a tad too soon, but still held some to cover near the lows. Entered short at 43.00 and 43.95, covered(exited) at 42.82,42.61,and 42.43.Initial risk was .08 cents,based on orders in the book. A little patience would have payed more on this one, I pulled the trigger on my exits a little soon.Exits make all the difference.Again I had at least three reasons for entering this trade, and none of those conditions had changed when I exited the first part. Follow your rules,for both entries and exits, and the payouts will come.

    Wednesday, August 03, 2005

    Last Minute Trade


    Ok, most of my trades are shown with a longer time frame, but I had to share this one off the 1 minute chart. My risk was only .03 cents. I still had rising MACD on the 1 minute and 5 minute charts, and a rounding bottom on the 13 minute ( or 15 minute if you prefer). I usually look for more confirmation, but I still had at least three reasons for entry, and a rising market in the last 20 minutes. Entered at 52.84, exited half at 52.99 and half at 53.25.

    Tuesday, August 02, 2005

    Watchlist / Scanner


    I'm currently trying out this stock scanner from trade-ideas. Seems to have many variables that you can adjust to your own liking. I'm in no way promoting it's use or giving it the thumbs up, but it seems very useful. This is definately worth taking a look at, and I am trying to apply my own trading strategies to it.I will update on results after my free trial. Many thanks to TraderMike for having it on his own site.

    Monday, August 01, 2005

    Earnings:Financial-Mortgage Investment

    LEND reports earnings tomorrow morning. Nyse stocks to watch for any sympathy moves are FRE,CFC,NEW,NFI. I will especially be watching NEW for any reaction.NEW has been in a pretty tight trading range the last 10 weeks, so we'll see how volume is on it.

    Charts vs. Book


    Just finished a long trade in JLL. I had been watching it for a while off the 50.00 level. Slowly it made its way up to a large order at 50.25, and as it printed I took a long position. The nyse book was somewhat thin, but the charts had all the makings of a great trade.JLL is still running as I write. I had a good trade in this one, but had I regarded the charts a little more rather than the book, I could still be in this trade.Notice the 5 period sma was never violated. If nothing has changed in the reasons for entry, which it didn't, then there is no reason to exit a trade like this. Rising 5 period, rising MACD, rising Stochastics. The charts said it all.Entered at 50.25, sold at 50.45,50.55,and 50.74. Combining the charts and the nyse book is a work in progress for me, which I'm trying to improve on.